years on the market

Friday, June 26th, today’s news—oil prices benchmarks are rising today, extending gains on optimism about a recovery in fuel demand worldwide. As the number of cases of COVID-19 coronavirus infection increases, the US economic recovery is likely to slow down. European stock indexes rose, despite concerns about an increase in the number of cases of coronavirus infection in a number of countries around the world. The price of Brent oil today is $41.45 per barrel, WTI—$39.05. EUR/USD is at 1.121; GBP/USD—1.141; gold is $1.769,65. Read the daily selection of analytical reviews from Grand Capital experts to navigate the market during a time of volatility.
Every morning on weekdays, our new Chief Analyst Vladimir Rojankovski in his videos talks about political decisions with market implications, global economy news, announcements from central banks and major companies, news of large economic events. Subscribe to our YouTube channel and never miss an update! Today we are discussing the impact of COVID-19 on the US market.
The currency pair is trading in the upper bound of the main descending price channel and the lower bound of the internal ascending price channel. The price is also in the range of 365 and 135 moving averages directed downward. A breakthrough in the round secondary level of 1.6920 will result in a breakthrough in the internal ascending price channel. The GBPCAD rate online: monitor the movement of the pair in real time.
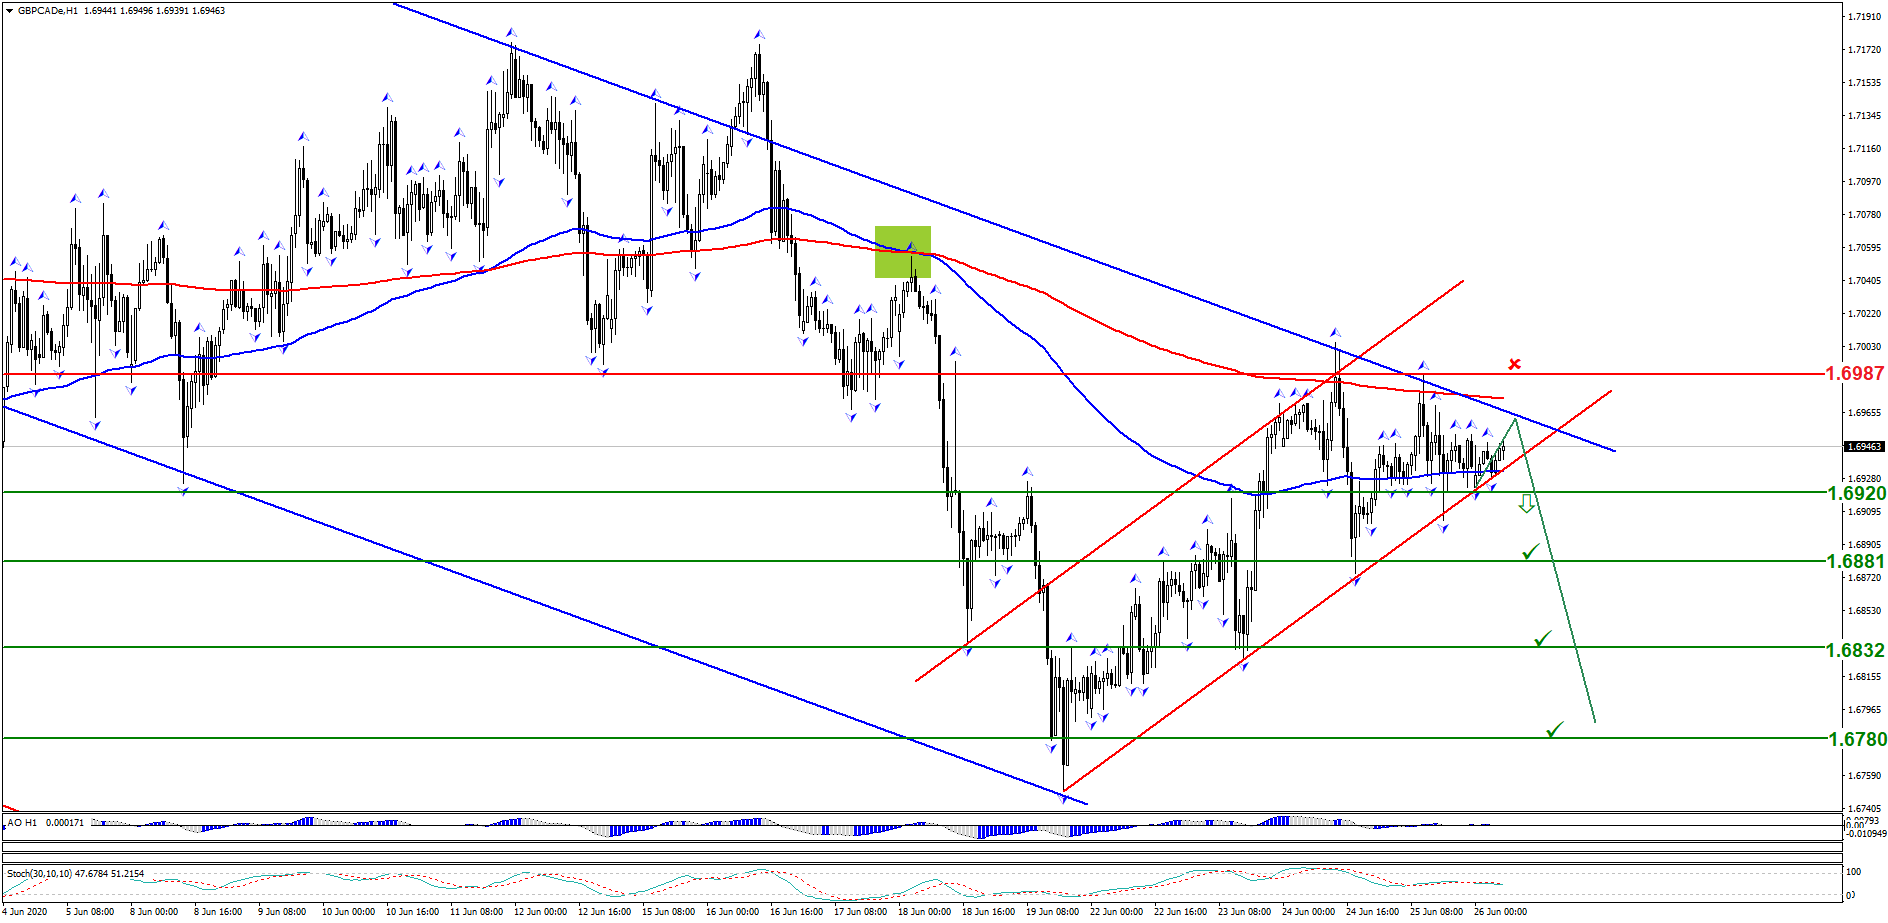
Trading recommendations: sell below 1.6920. Stop loss: 1.6987. Target levels: 1.6881; 1.6832; 1.6780.
The pair is in a narrow range of 1.3500-1.3665. It’s likely to decline today amid rising oil prices and improving market sentiment, which is reflected in increased demand for risky assets. The UASCAD rate online: monitor the movement of the pair in real time.
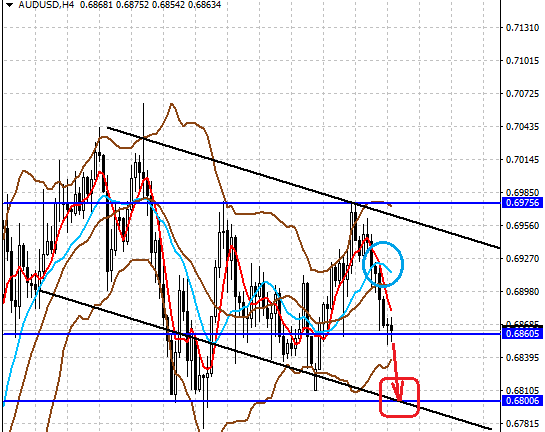
Trading recommendations: expect further decline to 1.3500.
The stock is trading in the range of the lower border of the ascending (green line) price channel and the upper border of the internal (red line) price channel. Stochastic Oscillator indicator signals oversoldness. The #NESN rate online: monitor the movement of the shares in real time.
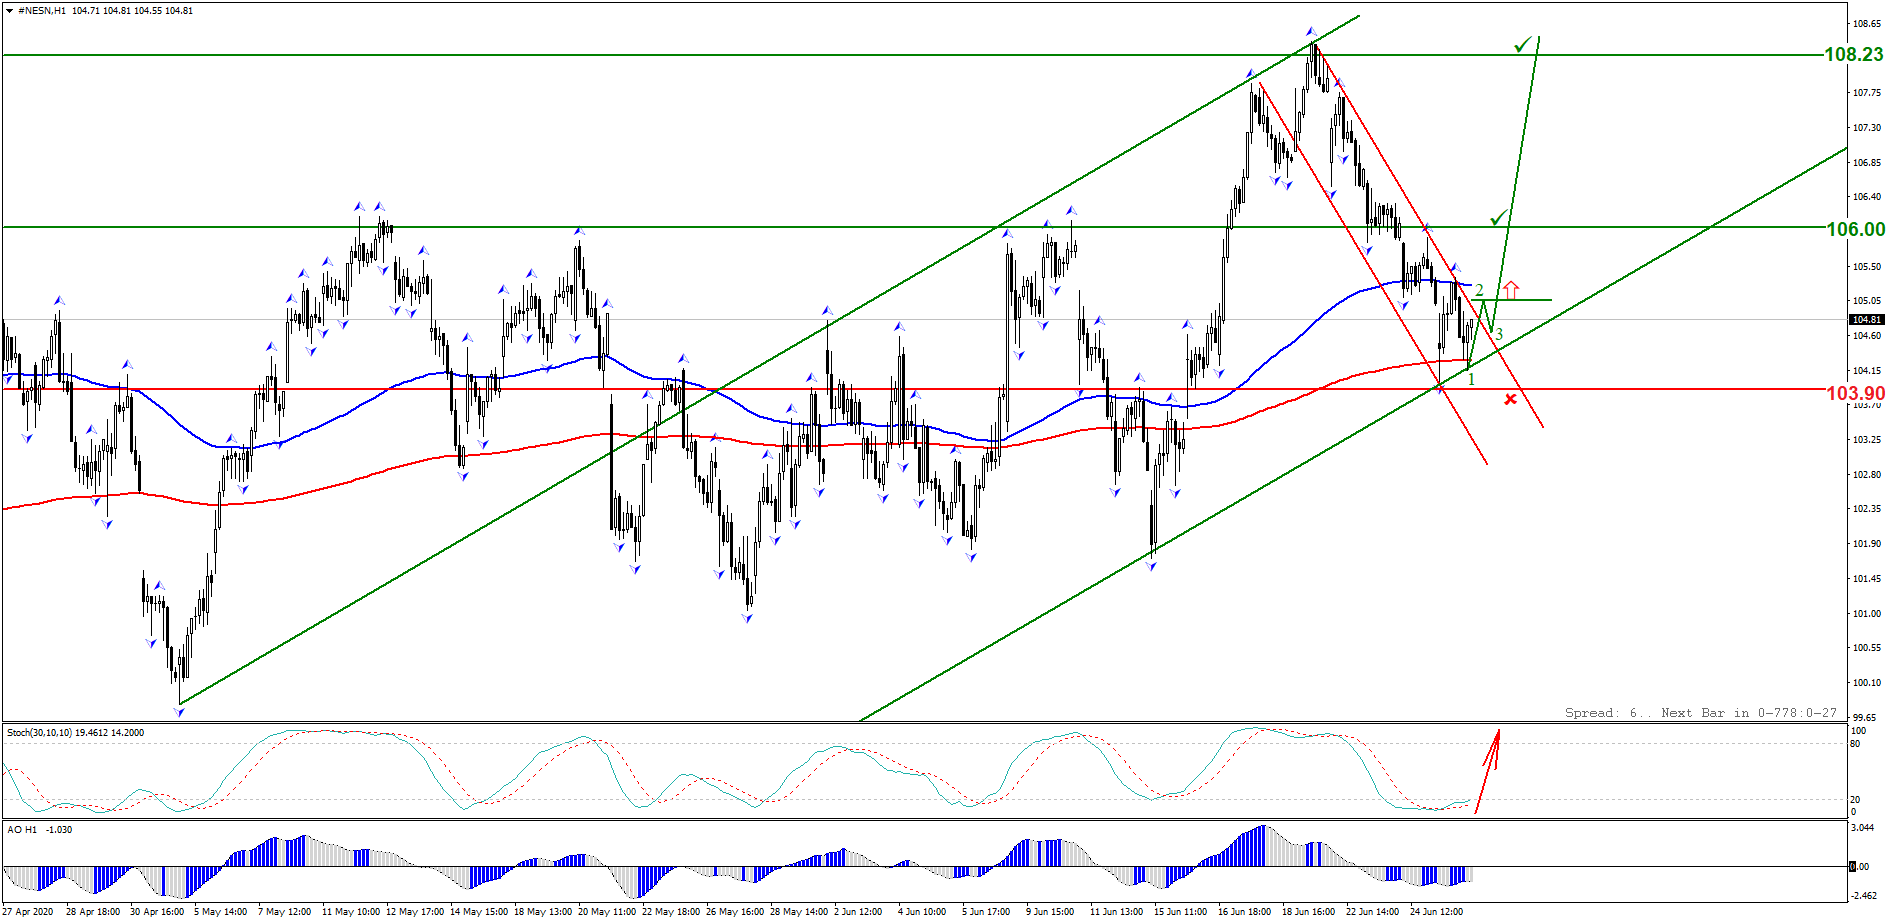
Trading recommendations: buy while an ascending 1-2-3 pattern if forming, where the first wave breaks through the upper border of the internal (red line) price channel. Stop loss: 103.90. Target levels: 106.00; 108.23.
Visit the new section on Grand Capital website to monitor the rate changes of your preferred instruments and get useful information to help you decide on a trading strategy.
*Trading recommendations offered by analysts do not constitute a solicitation. Before starting to trade on currency exchange markets, please make sure that you understand the risks connected with the use of leverage and that you have sufficient level of training.