years on the market

Thursday, June 25th, today’s news—stock indexes in Western Europe fell significantly on Wednesday amid investor concern about the growing number of cases of coronavirus infection in the world. Asian stocks posted their biggest drop in eight sessions, bonds rose and the U.S. dollar was firm on Thursday as surging U.S. coronavirus cases and an International Monetary Fund downgrade to economic projections knocked confidence in a recovery. The price of Brent oil today is $42.74 per barrel, WTI—$39.95. EUR/USD is at 1.124,6; GBP/USD—1.124,13; gold is $1.775,20. Read the daily selection of analytical reviews from Grand Capital experts to navigate the market during a time of volatility.
Every morning on weekdays, our new Chief Analyst Vladimir Rojankovski in his videos talks about political decisions with market implications, global economy news, announcements from central banks and major companies, news of large economic events. Subscribe to our YouTube channel and never miss an update! Today we are discussing the IMF's forecast for 2020: how the pandemic affected the world economy.
The pair continues trading in the range of 0.6800-0.6975 amid falling demand for risky assets due to the aggravation of the situation in the US around COVID-19, despite the continuation of the gradual recovery of the country's economy. The AUDUSD rate online: monitor the movement of the pair in real time.
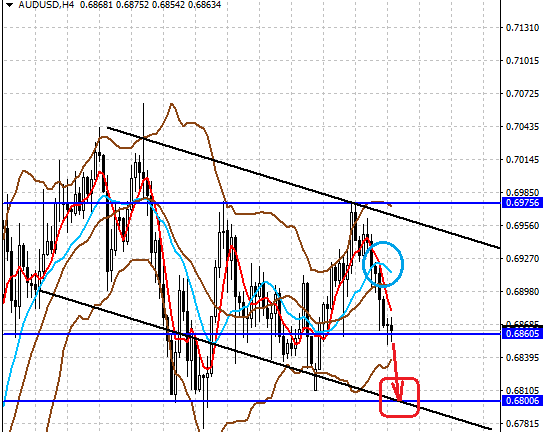
Trading recommendations: a decline below 0.6860 may lead it to further drop to 0.6800.
The ascending pattern of the H1 level is truncated. A bearish divergence has formed on Awesome Oscillator indicator, and Stochastic Oscillator indicator signals overboughtness. Probably the ascending pattern is a wave (B) of the descending pattern of the H4 level. The EURCAD rate online: monitor the movement of the pair in real time.
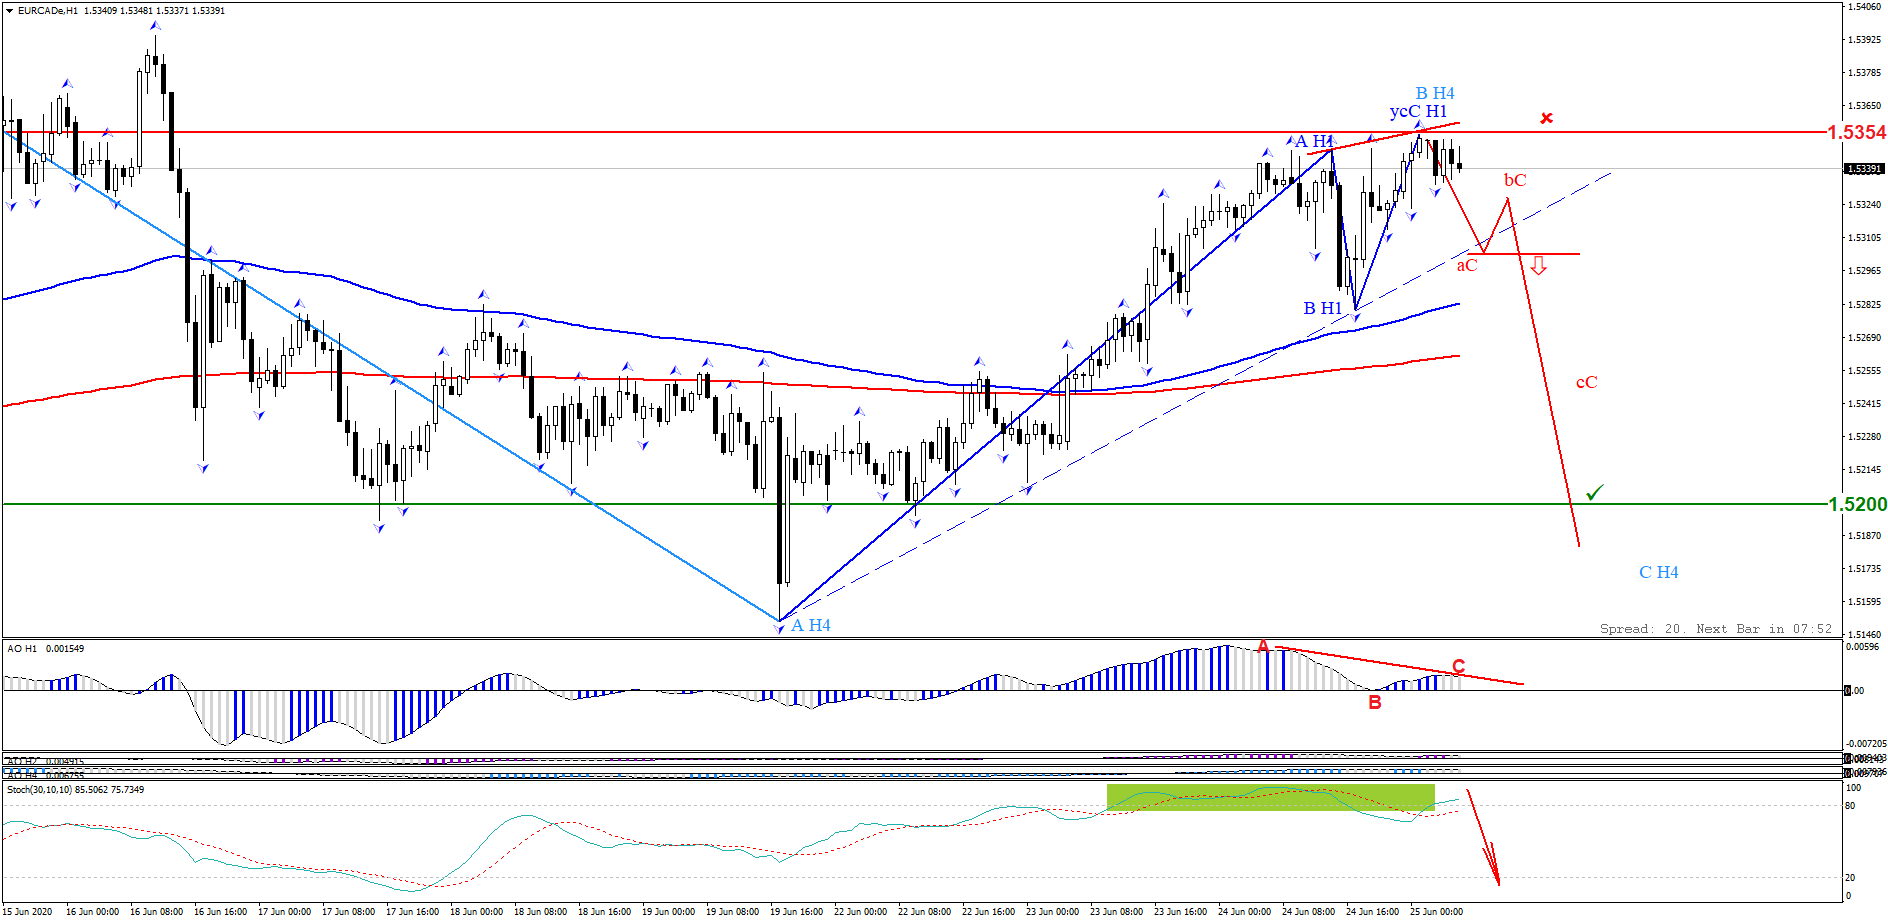
Trading recommendations: buy while a descending pattern is forming, where the wave (as) breaks through the inclined channel of the ascending truncated pattern of the H1 level, completing it. Stop loss for the local maximum (1.5354). Target levels: 1.5200; 1.5115.
The overall trend is upward. The stock continues to decline, while the downward pattern remains truncated. A bullish divergence has formed on Awesome Oscillator indicator, and Stochastic Oscillator indicator signals oversoldness. The #AXP rate online: monitor the movement of the pair in real time.
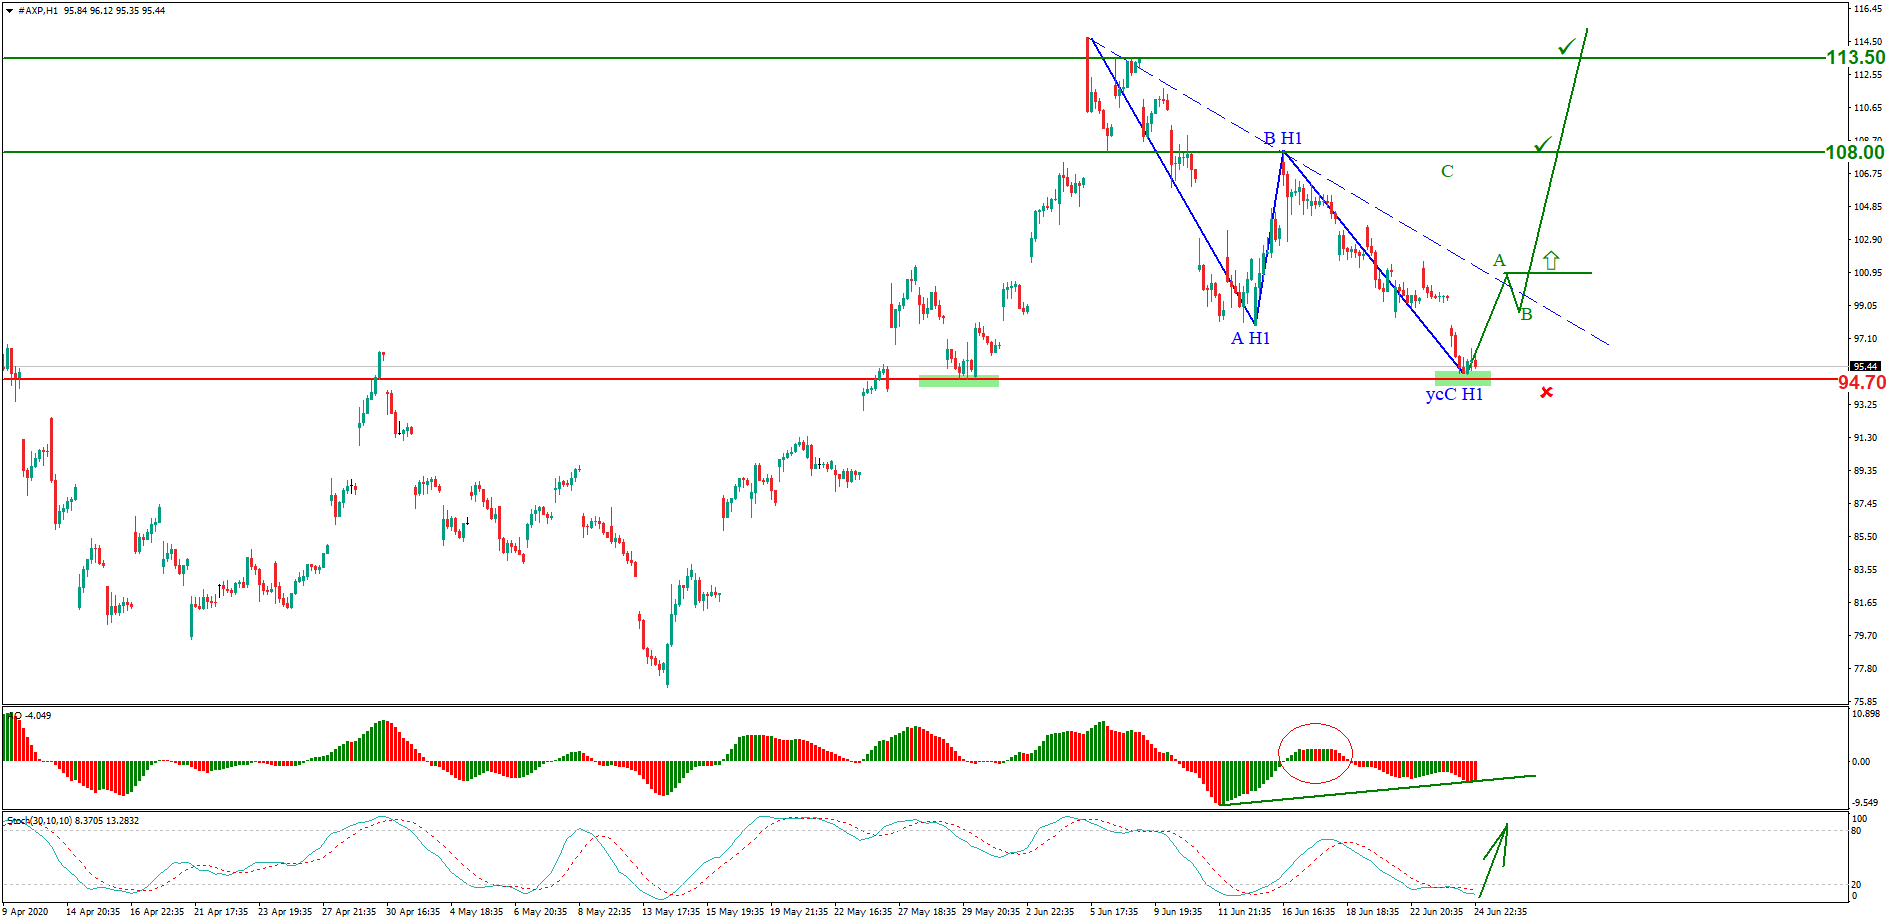
Trading recommendations: buy while an ascending wave pattern is forming, where the wave (A) breaks through the inclined channel of the descending truncated pattern of the H1 level. Stop loss: 94.70. Target levels: 108.00; 113.50.
Visit the new section on Grand Capital website to monitor the rate changes of your preferred instruments and get useful information to help you decide on a trading strategy.
*Trading recommendations offered by analysts do not constitute a solicitation. Before starting to trade on currency exchange markets, please make sure that you understand the risks connected with the use of leverage and that you have sufficient level of training.