Friday, July 24th, today’s news—both Asian and American markets are down amid the escalating US–China tensions, the dollar is weakened, oil prices are on decline again. French PMI is better than expected, British retail sales are nearing the pre-pandemic values. The price of Brent oil is $43.55, WTI—$41.36. EUR/USD is at 1.1602, GBP/USD—1.2723, gold is $1,893.35 per ounce. Read the daily selection of analytical reviews from Grand Capital experts to navigate the market during a time of volatility.
In his new video, our Chief Analyst Vladimir Rojankovski breaks down the stock price dynamic of the American tech giant Microsoft. Subscribe to our YouTube channel and never miss an update!
The pair is consolidating at 1.3425 amid the reduced demand for risk due to weak employment data in the US, which put pressure on the local stock market and the recovery of oil prices this morning. The pair may recover, although it still has the potential to continue to rise. Keep track of the price movement in real time.

Trading recommendations: if the pair rises above 1.3425, it will go further to 1.3470. From this level, or if it does not break 1.3425, sell it with a target of 1.3315.
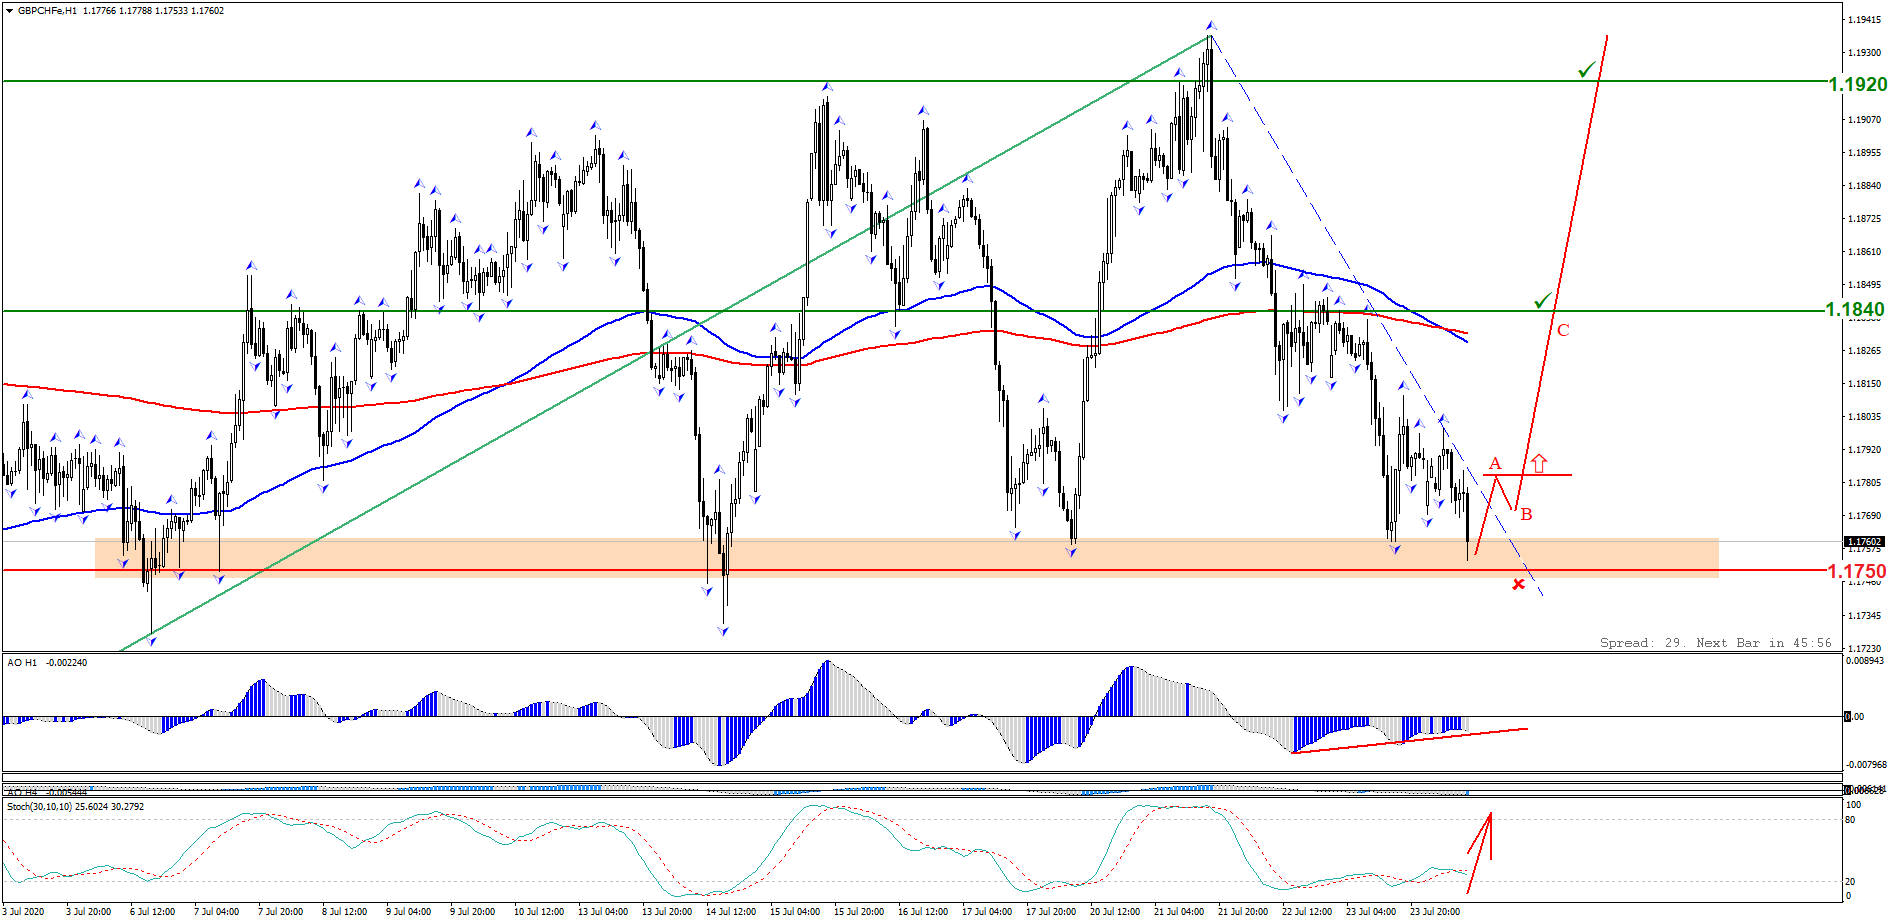
The currency pair is testing the support zone in the range of the round intermediate level 1.1750. Awesome Oscillator indicates a bullish divergence, while Stochastic Oscillator indicates an oversold situation. Keep track of the rate changes in real time.

Trading recommendations: buy when an ascending wave pattern is formed, where the wave (A) breaks through the inclined channel of the descending pattern.
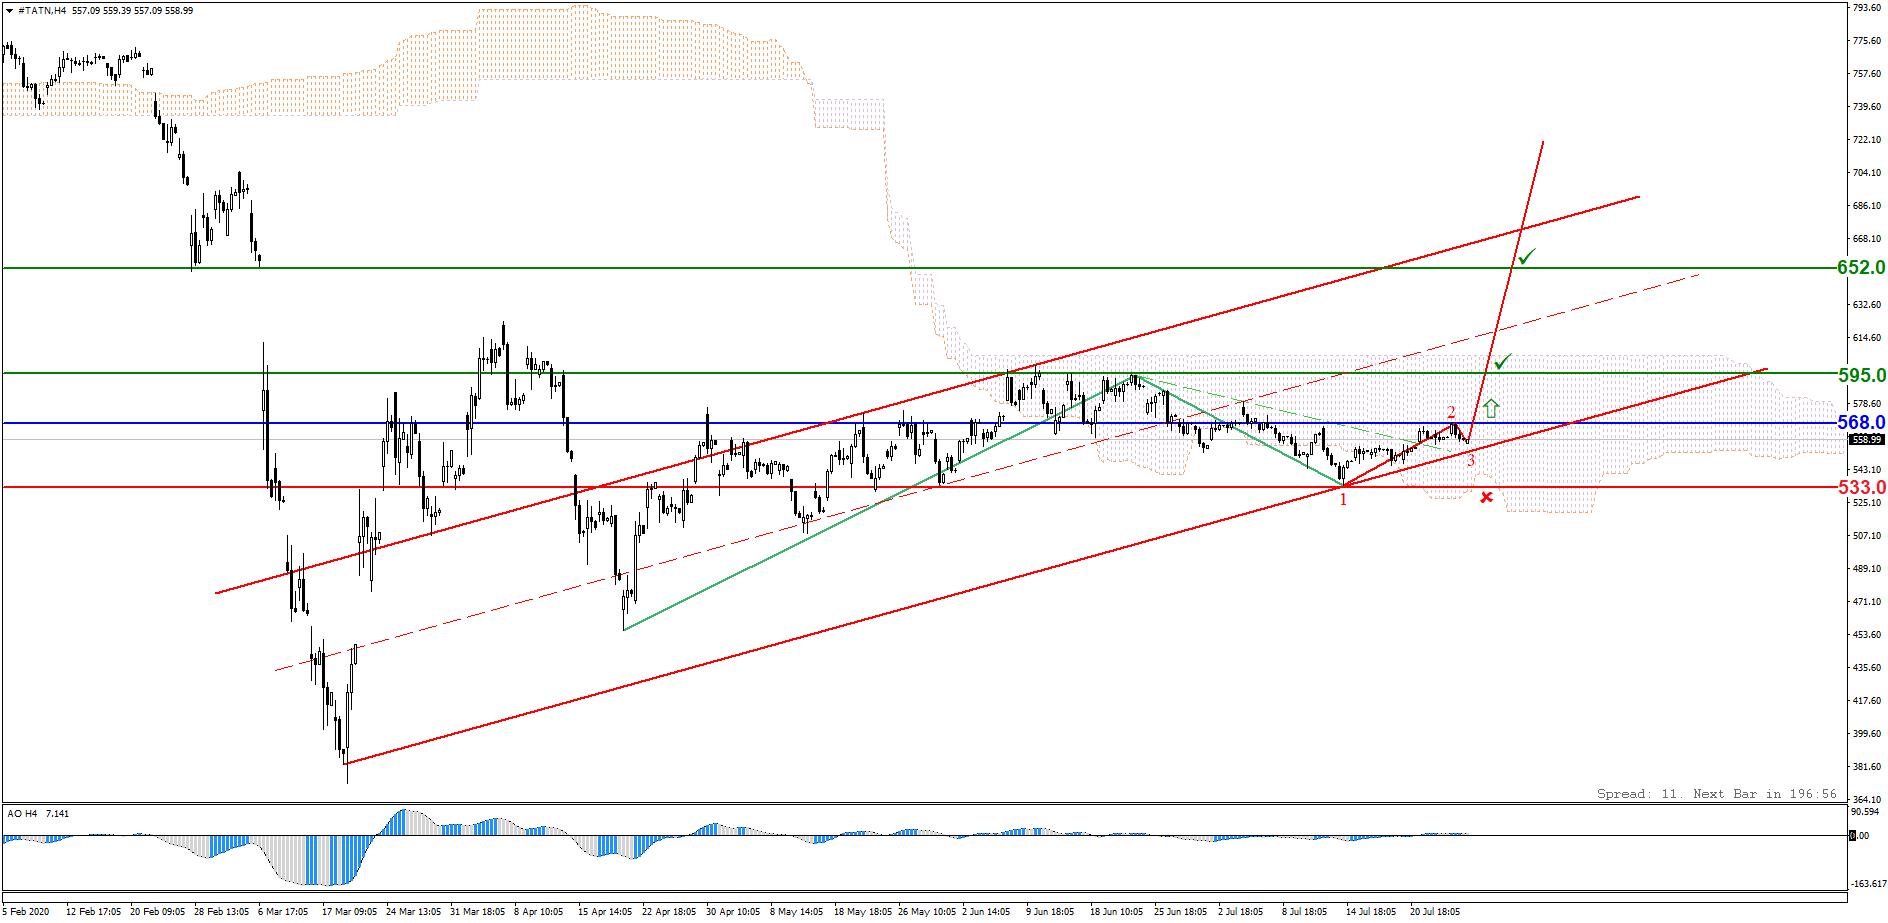
The stock is trading in the range of the lower border of the ascending price channel. A breakout of the support level of 568.0 will result in the formation of a 1-2-3 ascending pattern. Keep track of the rate changes in real time.

Trading recommendations: buy when an 1-2-3 ascending pattern is formed, above 568.0; Stop Loss under the support level 533.0; target levels: 595.0, 652.0.
Visit the new section on Grand Capital website to monitor the rate changes of your preferred instruments and get useful information to help you decide on a trading strategy.
*Trading recommendations offered by analysts do not constitute a solicitation. Before starting to trade on currency exchange markets, please make sure that you understand the risks connected with the use of leverage and that you have sufficient level of training.